|
|
|
|
|

Debugging the simulation
Next we'll take a brief look at some interactive debug features of the ModelSim environment. To start with, let's see what we can do about the way the List window presents its data.
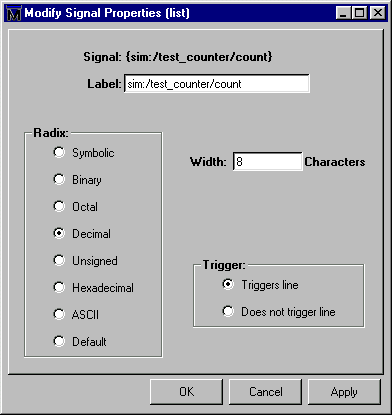
- In the List window select /test_counter/count. From the List window menu bar select Prop > Signal Props. The Modify Signal Properties (list) dialog box is opened.

Select a display radix of Decimal for the signal count. Click OK. This causes the List window output to change; the count signal is now listed in decimal rather than the default binary.
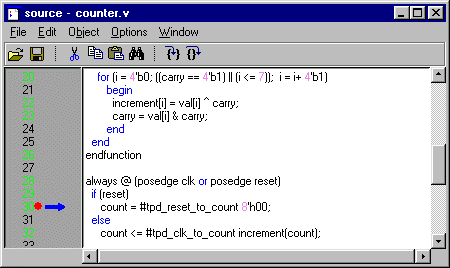
- Now let's set a breakpoint at line 30 in the counter.v file (which contains a call to the Verilog function increment). To do this, select dut: counter in the Structure pane of the Workspace. Move the cursor to the Source window and scroll the window to display line 30. Click on or near line number 30 to set a breakpoint. You should see a red dot next to the line number where the breakpoint is set.
The breakpoint can be toggled between enabled and disabled by clicking it. When a breakpoint is disabled, the circle appears open. To delete the breakpoint, click the line number with your right mouse button and select Remove Breakpoint.

- Select the Restart button to reload the design elements and reset the simulation time to zero.

(Main MENU: File > Restart) (PROMPT: restart)
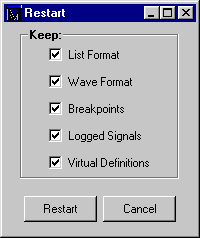
Make sure all items in the Restart dialog box are selected, then click Restart.

- Select the Run -all button from the Main window toolbar to resume execution of the simulation.

(PROMPT: run -all) (Main MENU: Run > Run -All)
When the simulation hits the breakpoint, it stops running, highlights the line with an arrow in the Source window, and issues a Break message in the Main window.
- Typically when a breakpoint is reached you will be interested in one or more signal values. You have several options for checking values.
You can look at the values shown in the Signals window; you can move your mouse pointer over the count variable in the Source window and press the right mouse button; or you can use the examine command:
examine countAs a result of your command the count is output to the Main window.
|
Model Technology Incorporated Voice: (503) 641-1340 Fax: (503)526-5410 www.model.com sales@model.com |
|
|
|
|
|